Water Quality by Distribution Zone
 What is an EPTDS?

Ground water is moved from the wells to storage tanks in large-diameter pipelines. The water is treated, including disinfection with sodium hypochlorite, which is generated on-site from table salt and water. (The product is like weak household bleach.)
Purified surface water is pumped to certain storage tanks and blended with treated ground water. At the Entry Point to the Distribution System or the EPTDS, blended water from a storage tank enters the distribution system to deliver water to individual neighborhoods and customer taps by gravity flow. Specific EPTDS(s) provide water to each distribution zone.
How Trunk Lines Work
From the valley to the heights, storage tanks are organized in trunks (example shown below). Pump stations move water from one storage tank to another. Purified surface water is pumped to storage tanks on both sides of the river and blended with treated water from wells. Samples are routinely taken at the EPTDS and in the distribution system.
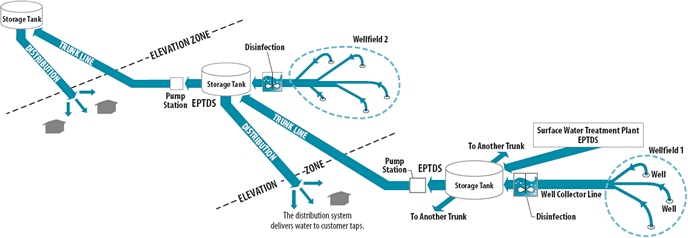
Now, because of the San Juan-Chama Drinking Water Project, we have a system of north/south pipelines that connect all the trunk lines. They help distribute the purified surface water and water from low arsenic wells throughout the system, on both sides of the river. This results is in a mixture of ground water and purified surface water in most storage tanks.
Results of Water Quality Testing
Interactive Map
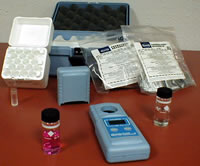
Chlorine Sample Test Kit
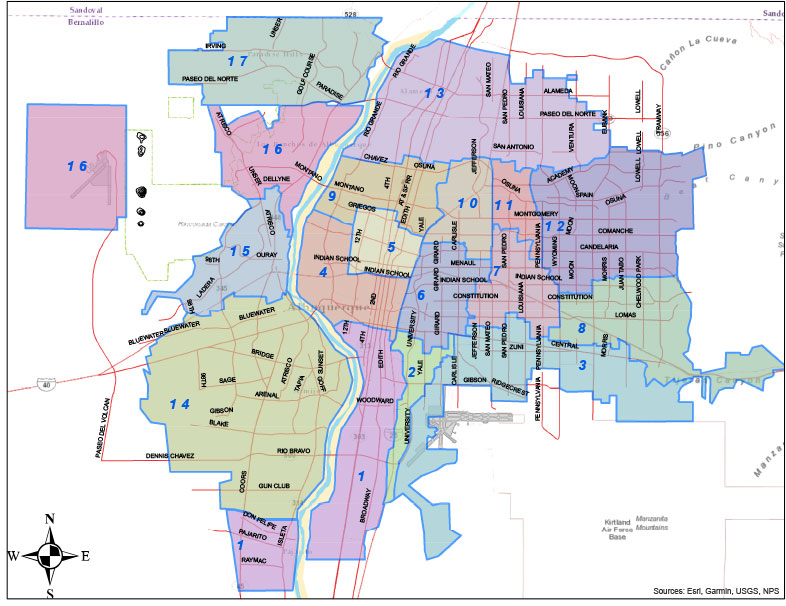
The water quality map below is linked to tables that show the results of voluntary monitoring. The Water Authority service area is outlined on the map. The blue lines on the map show the 20 distribution zones in the service area (including the zone for the North West Service Area, the former New Mexico Utilities, Inc). Use the map to identify your distribution zone.
The table for each distribution zone gives a summary of voluntary monitoring results for that zone. The citywide average is for the entire distribution system. This includes the results for the North West Service Area. For each zone, there are two tables.
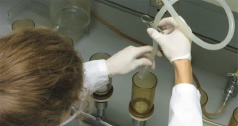
Lab Analyst Leah Gainer filters a water sample at the Water Quality Lab.
The first table shows the compliance results of water quality testing to meet USEPA drinking water quality regulations. Only the substances that were detected during the most recent compliance monitoring event at the EPTDS sites are listed in the table. The results for compliance monitoring for microbiological contaminants, disinfection by-products, and disinfectants measured throughout the distribution system are listed here.
The results of voluntary water quality testing are summarized in the second table. These additional samples are collected to monitor the distribution system more frequently and for more substances than current regulations require. Samples are collected in each distribution zone every three months.
How to Use This Map
- Find where you live on the map.
- Look for the blue number/name labeling the zone bounded in blue surrounding your house. That is your distribution zone.
- Click or tap on your distribution zone number/name for detailed reports on the water quality in your zone.