Welcome to the new Albuquerque Bernalillo County Water Utility Authority web site experience.
Returning customers log into “My Account in the top right hand corner and click the “reset password” option.
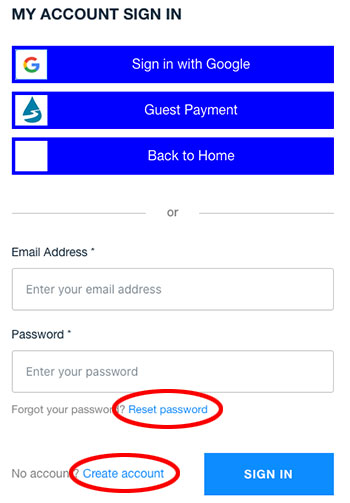
New customers please select the “Create Account” link to sign up.
